Bill Williams Awesome Oscillator Strategy: Big Profits, Small Losses

The Bill Williams Awesome Oscillator strategy is a momentum strategy that takes advantage of the most immediate trend. This method is similar to our Breakout Triangle Strategy because it will only give you entry signals when the momentum is confirming the price action shift. Momentum trading strategies offer traders an easy way to exploit short and mid-term trends.
Our team at Trading Strategy Guides puts a lot of effort into developing strategies that provide you with big wins and small losses. In essence, this means that from a risk management perspective, you’ll always trade with a superior risk-to-reward ratio. The AO Indicator (Awesome Oscillator) has been called the “super indicator” because of the incredible results some traders have had using it.
The Bill Williams Awesome Oscillator trading strategy can be applied across different markets, including stocks, commodities, indices, and Forex currencies. The preferred time frame for this strategy is the daily time frame. This is because, after extensive research and backtesting, our team at Trading Strategy Guides has learned that the daily time frame produces the best performance.
Now, if you’re a day trader and you like being in and out of your trades fast, don’t worry. We’ve got your back. Our favorite Day Trading Price Action- Simple Price Action Strategy can teach you how to profitably day trade any market. Also, read about the Forex Mentors and the best investment you can make.
Thanks for visiting Trading Strategy Guides (TSG)!
You have discovered the most extensive library of trading content on the internet. Our aim is to provide the best educational content to traders of all stages.
Learn Our Trading Best Strategy By our Founder Casey Stubbs
In other words, we want to make YOU a consistent and profitable trader.
If you’re a brand new trader, we recommend hopping over to our ultimate beginner’s guide to trading to learn more.
Before we move forward, we must define the indicators you need to trade the Bill Williams Awesome Oscillator strategy and how to use the Awesome oscillator indicator.
The only indicator you need is the Awesome oscillator indicator.
Table of Contents
What Is the Awesome Oscillator Indicator?
The Awesome Oscillator indicator is a histogram that is similar to the MACD indicator, which displays the market momentum of a recent number of periods compared to the momentum of a larger number of previous periods.
If you’re interested in learning more about the MACD indicator, we recommend studying the MACD Trend Following Strategy, which is an out-of-the-box trend-following strategy.

What about the indicator setting?
See below:
What Are the Awesome Oscillator Best Settings?
The Awesome Oscillator indicator uses inbuilt default settings of 5 vs. 34 periods.
So, how does it work?
Well, the Awesome Oscillator indicator’s histogram (see chart below) is derived from the price chart. The Awesome Oscillator histogram is a 34-period simple moving average. This histogram is plotted through the central points of the bars (H+L)/2, subtracted from the 5-period simple moving average, and graphed across the central points of the bars (H+L)/2.
What Is the Awesome Oscillator Formula?
MEDIAN PRICE = (HIGH+LOW)/2.
Awesome Oscillator = SMA(MEDIAN PRICE, 5)-SMA(MEDIAN PRICE, 34).
If the AO histogram is crossing above the zero line, that’s indicative of bullish momentum. Conversely, when it crosses below, that’s indicative of bearish momentum.

How to Use the Awesome Oscillator Indicator?
The Awesome Oscillator by Bill Williams is a versatile indicator that can be used to:
- Exploit trends.
- Gauge the market momentum.
- Anticipate possible trend reversals.
The simplest and most straightforward way to use Williams’ Awesome Oscillator is the crossover of the zero line. However, there are other unique signals, such as the Awesome Oscillator saucer signal or the Twin Picks or bullish bearish divergences.
If you’re curious about how powerful these AO signals are, keep reading.
Then, let’s move on!
How to Use the Awesome Oscillator Zero Line Crossover
Put simply, the zero-line crossover measures the change in market momentum:
- When the Awesome Oscillator crosses above the zero line from below, it signals a bullish momentum and a potential trend reversal.
- When the Awesome Oscillator crosses below the zero line from above, it signals a bearish momentum and a potential trend reversal.
See the AO chart below:

When the AO crosses above the zero line, it shows that the short-term momentum is rising faster than the long-term momentum.
This information is extremely useful because a shift in the trend direction will always appear first in the short-term trend, and then it will spread out on the long-term trend.
Clearly, this is a sign of a reversal.
Now, you might be familiar with the zero-line crossover signal since this is a common trade signal with many technical indicators.
However, the Awesome Oscillator tends to give far fewer false signals when compared to other oscillators.
See the AO chart below:

Out of the 4 zero-line crossover signals, only 1 was a false signal.
Compare that with the MACD indicator, which generated far more signals and inevitably far more false signals.
See the Forex chart below:

So, here is the takeaway:
During strong trending markets, the Awesome Oscillator will keep you riding the trend, while other momentum indicators will stop you out on a minor pullback or retracement.
Next…
Let’s go over another Awesome Oscillator secret.
See below:
What Is the Awesome Oscillator Saucer?
The AO saucer signal helps you identify pure momentum continuation trades. In other words, if you miss the boat on a trend signal, the Awesome Oscillator saucer will give you a second chance to enter a trend or simply build up your Forex position.
Let’s be honest here:
We have all gone through missing an entry of a new trend, and often, the fear of missing out on a move leads to taking bad trades. So, how do we deal with missing trading opportunities?
Without chasing the market, we use the Awesome Oscillator saucer signal. The saucer setup is formed by 3 consecutive bars on the AO histogram either above the zero line or below the zero line.
I’ll explain…
A bullish saucer happens when these four conditions are satisfied:
- The AO histogram is above the zero line
- We have 2 consecutive red bars
- The second red bar is lower than the first bar
- The third bar is green and higher than the second bar
See the Awesome Oscillator chart below to see what I mean:

Note: For better visualization, we have to change the Awesome Oscillator settings from the histogram to the columns.
If you want to learn how to change the AO settings yourself, simply click on the TradingView gear icon, AO Style, and choose columns instead of the histogram.

As you can probably tell, the Awesome Oscillator saucer gauges short-term changes in the speed of the trend. Conversely, the bearish saucer signal occurs when these four conditions are satisfied:
- The AO histogram is below the zero line
- We have 2 consecutive green bars
- The second green bar is lower than the first bar
- The third bar is red and lower than the second green bar
See the Forex chart below:

The final Awesome Oscillator signal is the twin peaks.
We’ll outline a step-by-step trading strategy around the twin peaks signals.
Now, let’s move forward to the most important part of this article, the trading rules of the Bill Williams Awesome Oscillator trading strategy.
Now, before we go any further, we always recommend noting down the trading rules on a piece of paper.
Let’s get started…
Bill Williams Awesome Oscillator Strategy Rules (Rules for a Buy Trade)
Step #1: Check If the Awesome Oscillator Indicator Is below Zero.
First, we want to make sure the Awesome Oscillator indicator is below zero. This first rule is part of a three-rule pattern called the Awesome Oscillator Twin Peaks.
Don’t worry; this will start to make more sense once we go through all three rules.

This brings us to the next rule.
Step #2: Check If the Awesome Oscillator Indicator Displays Two Swing Lows and the Second Low Is Higher than the First.
Second, you need to check if there are two consecutive swing lows of the Awesome Oscillator histogram and if the second low is higher than the first one. These two swings will form the twin peaks, and from here comes the term Awesome Oscillator Twin Peaks.

There is one more rule for the Awesome Oscillator’s Twin Peaks pattern to be validated.
Step #3: Check If the Awesome Oscillator Indicator Histogram after the Second Low Is Green.
We need the Awesome Oscillator indicator histogram after the second low to immediately turn green. This will validate the Awesome Oscillator Twin Peaks pattern. When the AO histogram turns green, it indicates buyers stepping in, but only a break above the zero line will signal a real shift in the market sentiment.

Now, the Awesome Oscillator Twin Peaks pattern has been completed. However, we still don’t have confirmation that the buyers have taken the lead, which brings us to the next step of the Bill Williams Awesome Oscillator trading strategy.
Step #4: Wait for the Awesome Oscillator Histogram to Break above the Zero Line Before Buying at the Current Market Price.
As we already learned, the Awesome Oscillator indicator fluctuates between positive momentum when trading above the zero line and negative momentum when trading below the zero line. You can notice that the AO histogram bars can change from green to red while she stays above/below the zero line.
This indicates various degrees of momentum strength. Nonetheless, the real shift in sentiment happens once the AO histogram crosses above the zero line, which is why this is our entry signal.
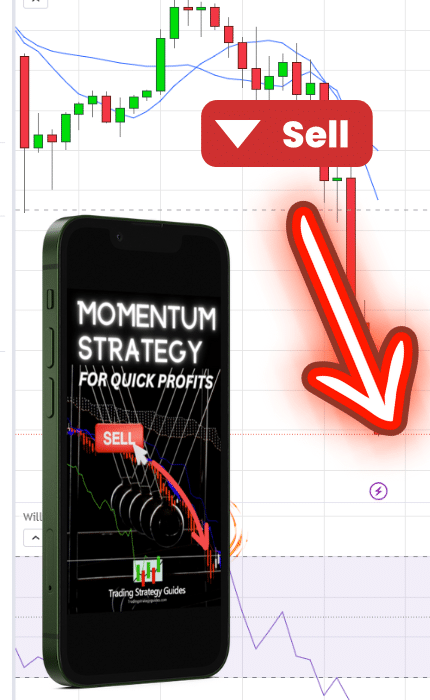
Also, check out our guide on the best momentum trading strategies.

At this point, your trade is opened, but we still need to determine where to place our protective stop loss and take profit orders, which brings us to the next step of our strategy.
Step #5: Place Your Protective Stop Loss below the Most Recent Swing Low, Which Should Align with the Second Swing Low of the AO Twin Peaks Pattern.
The Awesome Oscillator histogram should normally align with the price action. In this regard, whenever the price forms a swing low, this should be visible in the AO histogram as well.
We don’t want to add any buffer below the swing low level because any slight break below the swing low will invalidate the AO Twin peaks pattern.

Now, the only component that needs to be clarified is where to take profit, which brings us to the final step of the Bill Williams Awesome Oscillator trading strategy.
Step #6: Take Profit as Soon as the Awesome Oscillator Histogram Posts Two Consecutive Red Bars.
We take profit immediately after the market shows us the first sign of weakness. In this regard, when the AO histogram posts two consecutive red bars, we want to close our position and take profit, as there is a high probability the market will reverse thereafter.

Note: The above information was an example of a buy trade… Use the same rules but in reverse for a sell trade. In the figure below, you can see an actual SELL trade example using the Bill Williams Awesome Oscillator strategy.

Final Thoughts – Bill Williams Awesome Oscillator Trading Strategy
The Bill Williams Awesome Oscillator strategy is a great method if you’re a momentum trader. We’re not looking to catch tops and bottoms, but we seek to enter the market when the momentum has shifted in our favor.
This is a more sophisticated way to trade breakouts because they also signal a shift in momentum. If you’re a fan of breakout trading, we recommend reading the Breakout Triangle Strategy, which will teach you how to correctly trade breakouts.
Moreover, the most popular Bill Williams Awesome Oscillator strategy is trading the Awesome Oscillator Twin Peaks pattern because, most of the time, it signals trades with a superior risk-to-reward ratio.
By embracing this strategy, traders can enhance their decision-making process, leveraging the oscillator’s ability to clearly indicate the market’s momentum. This approach not only simplifies the analysis of complex market trends but also aids in identifying optimal entry and exit points, thereby maximizing potential gains while minimizing risks.
Thank you for reading!
Please leave a comment below if you have any questions about Bill Williams Awesome Oscillator Strategy!
Also, please give this strategy a 5 star if you enjoyed it!
Bill Williams Awesome Oscillator Strategy Video
Please share this trading strategy below and keep it for your own personal use! Thanks, traders!


The Bill Williams Awesome Oscillator is extremely powerful…. Whats your experience with using this indicator? If you never have used this in your trading before try this strategy out and let us know what your results were!
Thanks for the article, I think this could be a powerful strategy that could get some really big wins.
Thanks Casey.
Nice explanation, keep it your good work. Thank you
Thanks! We will do our best to help every trader find a strategy that works for them…
There is a typo error in the articule. It was mentioned as big loss instead of big profit.
HELLO
Can you help me to set this indicator on TC2000. It would be awesome if you can
thanks
Thank you for this! Other time frame strategies?
No problem! Yes you can use this on multiple time frames.
Hey there! Are you looking for other time frame trading strategies? We have a ton of them you can search around on our blog.
Thanks,very nicely and clearly explained.
So nice and helpful thanks
Excellent explanation with colorful charts.
Thanks!
great indicator Thank you and explanation